Dashboard
Objective: It allows user to view the Action Items, Incident & Safety Observation statistics with status in the system.
SAFETY COCKPIT DAHBOARD
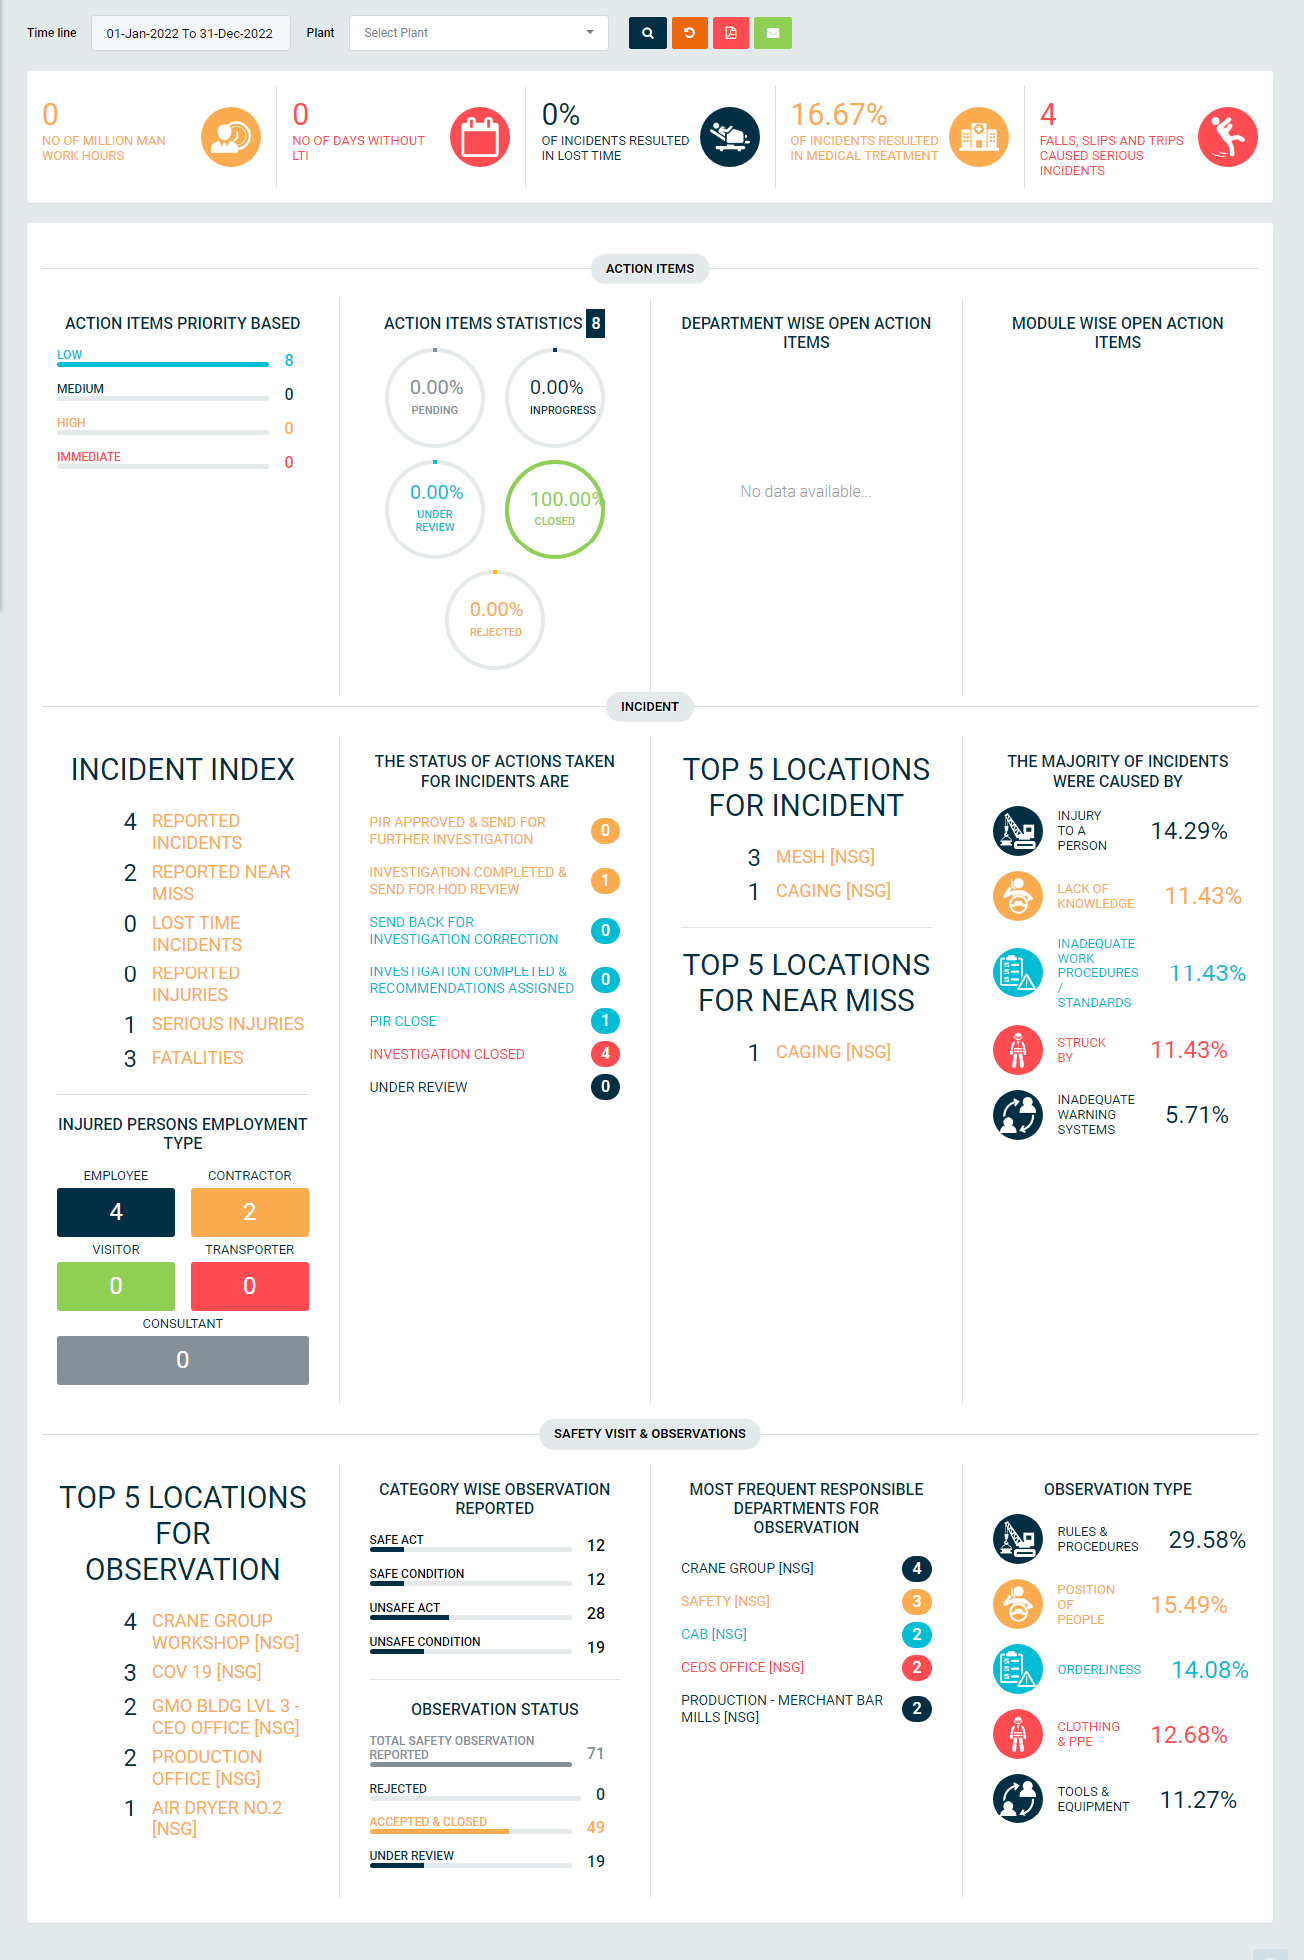
Image 1
- Select search criteria such as Time line, Plant/Site as per requirement.
- Click “Search” button to populate Action Item details in a tabular format.
- Click “Reset” button to clear all the selection criteria and refresh report screen.
- Click “Export to PDF button” to export the report to PDF.
- Click “Mail” to report dashboard.
- It has details as No of Man Work Hours, No of Days without LTI, No of Incident resulted in Lost Time, No of Incident resulted in Medical Treatment, Falls, Slips and Trips caused serious Incidents.
- Different chart for Action Item (Recommendation) Priority Based, Action Item(Recommendation) Statistics, Department wise Open Action Items, Module wise Open Action Items.
- For Incident, it display the statistics as Incident Index, the status of actions taken for incident are, top 5 locations for incident, the majority of incidents were caused by, Injured Persons Employment Type
- For Safety Observation, it display the statistics as Top 5 Locations for Observation, Category Wise Observation Reported, Most Frequent Responsible Department for Observation, Observation Type, Observation Status