Dashboard
Objective: It allows user to view the pictorial representation of SHE activity data.
SAFETY COCKPIT DAHBOARD
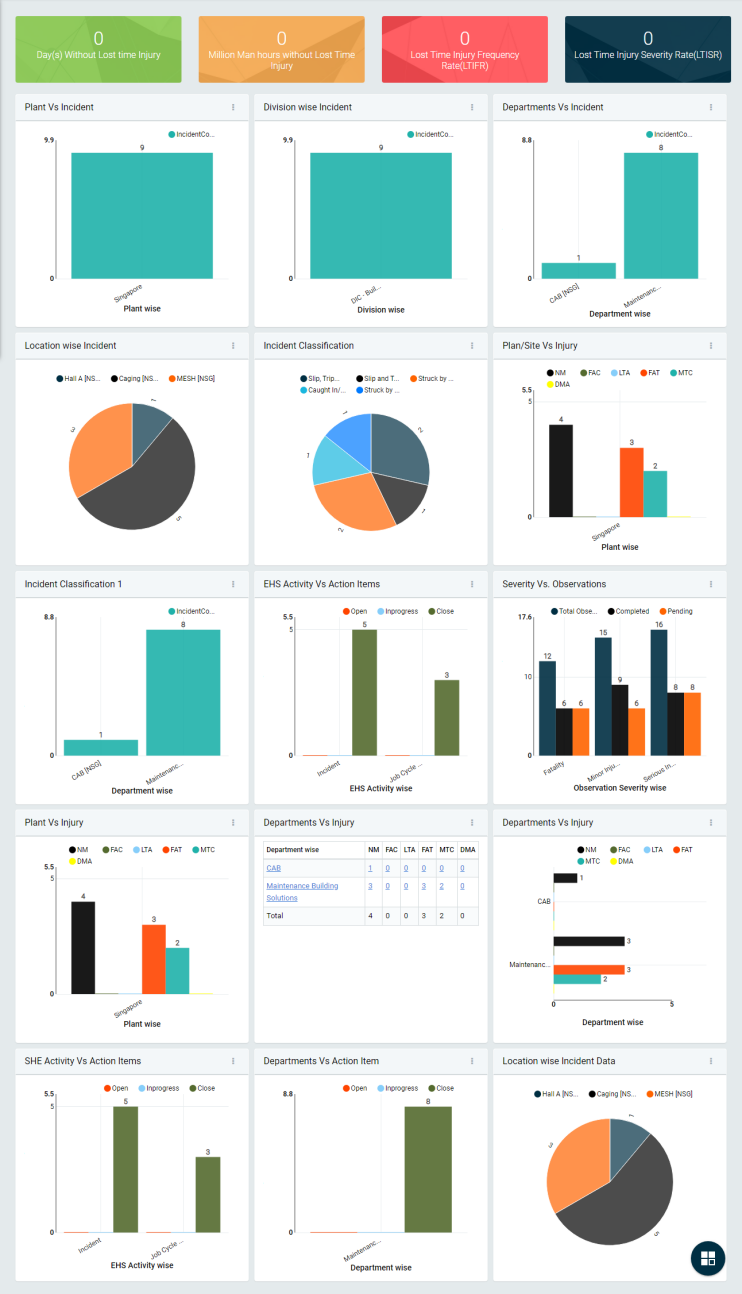
Image 1
- It shows different chart for Timeline (Months) vs Observations, Plant/Site vs Observations, Department vs Observations, Category vs Observations, Observation Type vs Observations, Severity vs Observations, Department vs Action Item, Timeline (Months) vs Action Item, Plant/site vs Action Item, EHS Activity vs Action Item, Priority vs Action Items.
- There are three dots which are clickable with options as Maximize, Export to png, Export to excel, Apply Filters, Remove Widget.
- Filters have option such as Chart Type, Segregation, Plant/Site, Timeline, Department, Module Type, Task Priority, Status, Segregation Filter.
- Chart type (Column, Table), Segregation type(Timeline wise(Monthly), Department wise, Plant/Site wise, SHE Activity type, Priority Wise), Timeline (Last 7 days, last 15 days, Last 30 days, Last 2 months etc).
- Segregation Filter (Open, In progress, Close)